Business reports, live dashboards & an AI assistant that answers in plain English.
Every number in Caravan Trade comes from the documents your team already keys in — so the dashboard is live, the reports reconcile, and when you ask “which customers owe us the most?”, the answer arrives with the figures and the query that produced them.
The numbers exist. Getting them shouldn’t take all afternoon.
Most trading businesses answer questions by exporting, filtering and phoning — and by the time the answer lands, the data has moved.
Answers from exports
- “Top customers this year” means an export, a pivot table and an hour
- Sales, stock and receivables live in three files that never quite agree
- Overdue invoices are discovered when the bank balance surprises you
- “Who changed this price?” has no answer at all
- Every figure quoted in a meeting is already a week old
Answers in Caravan Trade
- Ask the assistant in plain English and get the figures in seconds
- One dashboard over the same documents purchasing and sales work from
- Overdue receivables flagged on the tile, aged in the report
- Every change recorded with who, when and what it was before
- Reports are live the moment you open them — and export to CSV
Ask your business a question. Get the number.
The analytics assistant docks beside whatever you are working on. Type a question the way you would ask a colleague — no report to build, no filters to set — and watch the answer stream in.
- It reads your live data — purchases, sales, invoices, stock, partners and costs, as they are right now, in your own database.
- It shows its work. Every answer cites the tables it read and the exact SQL it ran — the citations come from the executed query, so they cannot be invented.
- Charts and tables, not paragraphs — the shape that answers the question, with numbers right-aligned and ready to act on.
- Read-only, always. One guarded SELECT per question, capped at 500 rows. It queries; it never edits, deletes or moves anything.
- Your questions are kept. Every conversation is saved under your account — reopen last week’s thread and see exactly what you were told, verbatim.
Answers in seconds, and it names the model that produced them — no black box.
- Grounded on your own schema
- Query written
- Read-only SELECT, capped at 500 rows
- 5 rows in 1 ms
Coastal Gifting Co. leads this year’s invoiced sales, with the top five customers together accounting for ₹ 92.6 lakh:
| Customer | Invoiced |
|---|---|
| Coastal Gifting Co. | ₹ 31,40,250 |
| Himalaya Naturals | ₹ 24,08,900 |
| Deccan Hampers | ₹ 15,72,600 |
| Bazaar One Retail | ₹ 11,95,000 |
| Kesar House | ₹ 9,44,180 |
How a plain-English question becomes a number you can trust
The assistant is not a chatbot bolted onto a database. Every step between your question and the answer is visible — and guarded.
1. Ask
Type the question as you would say it. No query language, no report builder.
2. Ground
The question is grounded on your own schema and a curated business vocabulary — a metric is what the contract says it is.
3. Guard
The generated query must be a single read-only SELECT, capped at 500 rows. Anything else is rejected.
4. Run
It runs against your own database — the live figures, not a stale copy.
5. Show its work
The answer streams in with the figures, the tables it read and the exact SQL — checkable, not takeable-on-faith.
Each step reports itself in the panel as it happens — a checklist, not a spinner — and the whole trace stays under the answer, with the model named and the time it took.
The morning screen: live KPIs, and what needs attention
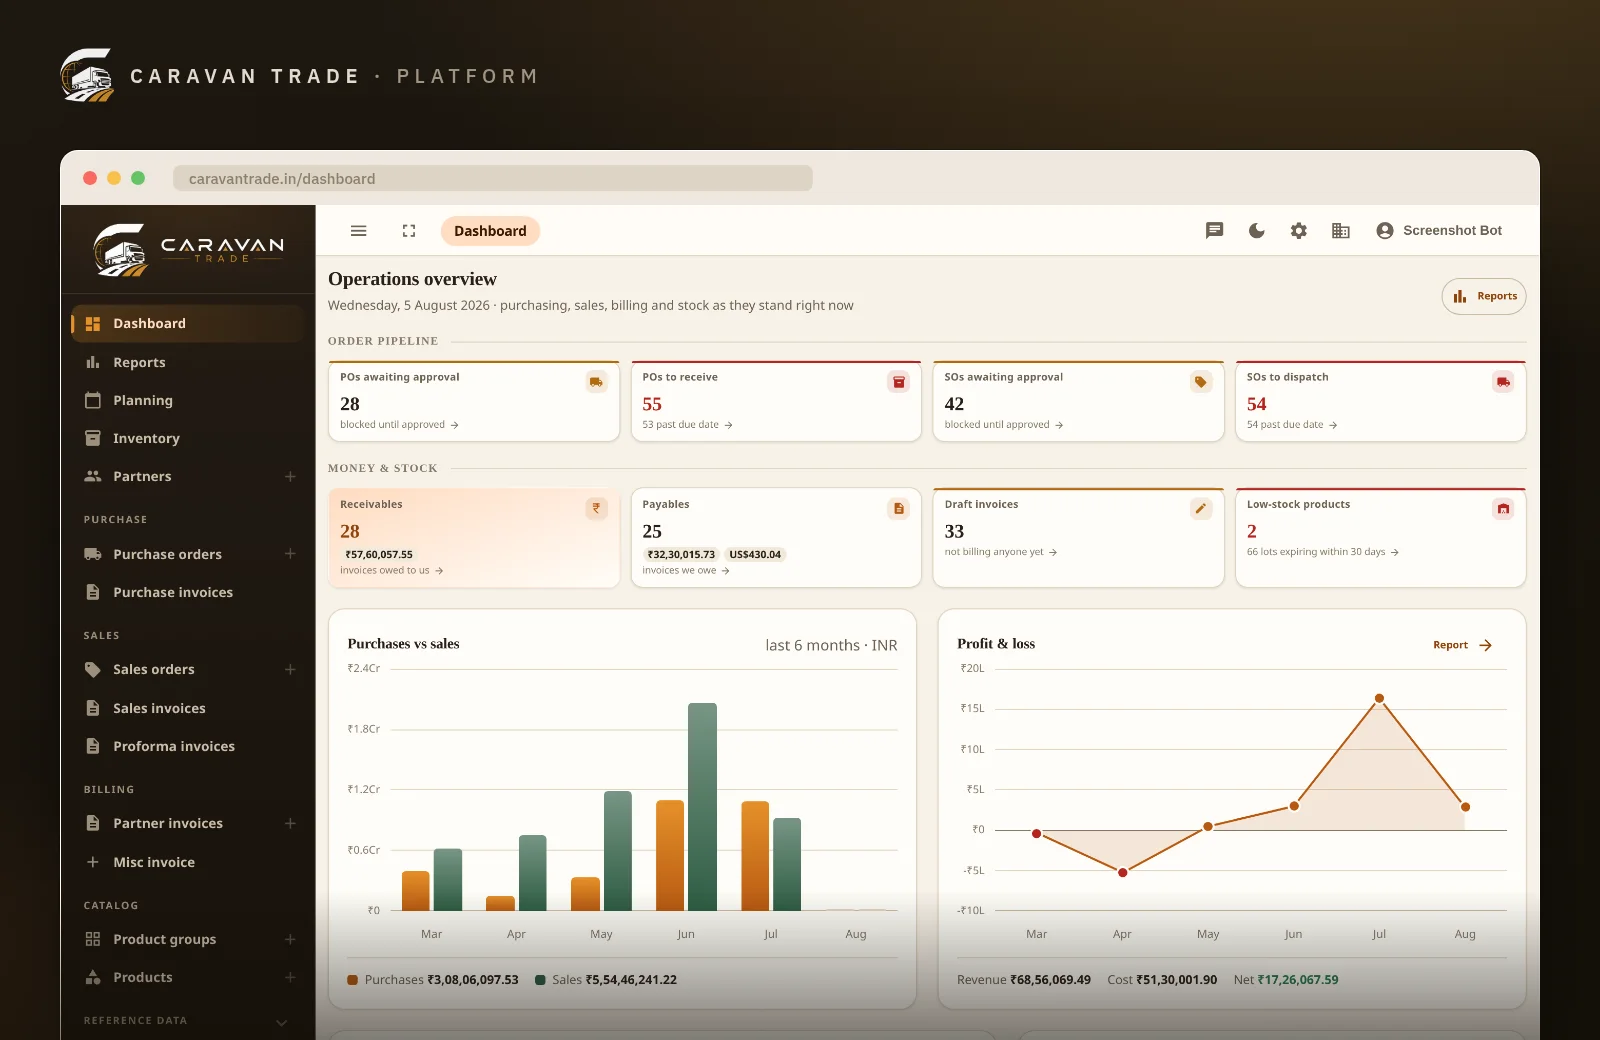
One dashboard opens the day: this month’s sales and purchases against last month with a sparkline of the year behind each figure, receivables and payables per currency with the overdue portion flagged, and stock value with low-stock warnings — every tile a link into the report behind it.
- Headline KPI tiles — sales, purchases, net, receivables, payables, stock value
- A needs-attention strip: overdue orders, draft invoices, low stock, expiring lots
- Money-flow and order-flow charts over the last months
- Receivables & payables aging, bucketed by how overdue
- Documents awaiting approval, oldest first, with days waiting
- Arriving shipments and dispatches for the next 14 days, late ones flagged
- A live activity feed of recent changes — fed by the audit trail
Nine reports, each a grid and an analytics view
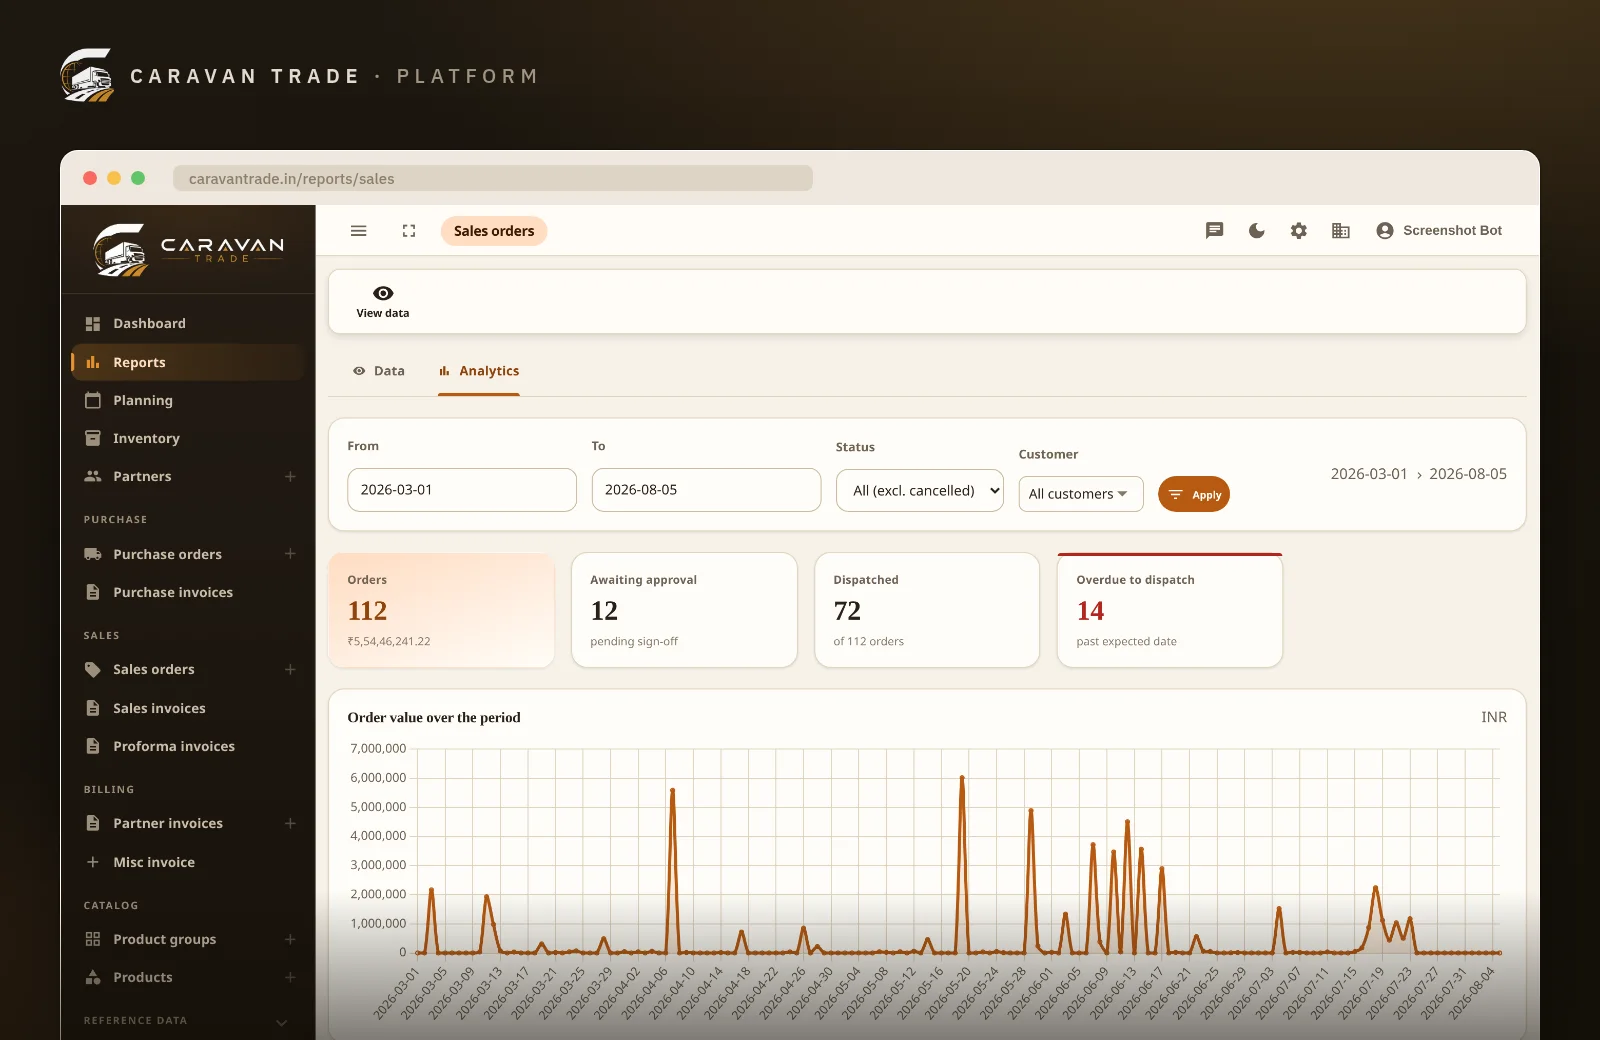
Every report comes in two tabs over the same filtered data: Data when you need the rows, Analytics when you need the shape. Filters carry across both, the figures are current the moment you open them, and the data tab exports to CSV — so the spreadsheet your accountant gets is the screen you were just looking at.
- Sales, purchasing, inventory, invoices, order costs, P&L, position, GST/HSN and partners
- Data + Analytics tabs with filter state carried between them
- CSV export of the filtered rows on every data tab
- Per-currency figures kept apart — never blended into a fictional total
- A reports hub grouped by category, with your recently viewed reports
- GSTR-1 HSN summary for GST-registered businesses, ready for filing season
Every change, with its author — the full audit trail
“Who changed this price?” gets an answer. The audit trail is written at the persistence layer, so every change that actually saves is recorded — whichever screen it came from, and including imports and background jobs. Each entry names who, when, and which fields moved from what to what.
- Who made the change, and exactly when
- Field-level before and after values, frozen as they read at the time
- Creates, updates and deletions — deletions included
- Only changes that really committed — a failed save leaves no phantom entry
- Its own permission-gated screen, plus the dashboard’s live feed
“The questions we used to save for the accountant’s visit, we now just type. And the answer comes with the query, so nobody has to take it on faith.”
Ask it about your own trade. Book a 30-minute demo — no credit card, no obligation.AI you can put in front of your books
An assistant that touches business data has to earn its place. These are the rules it runs under — by construction, not by policy document.
- Read-only, enforced
- Every generated query passes a guard that accepts one SELECT statement and nothing else — no updates, no deletes, no schema changes, no comment tricks — and caps the result at 500 rows. The assistant physically cannot write.
- Citations are facts
- The “sources” on an answer are derived from the query that actually executed, never from asking the model what it used. If the statement read your sales invoices, that is what is cited — nothing else can be.
- Your own database
- Every customer’s data lives in a separate database, and the assistant queries yours over your own connection. There is no shared pool it could leak across.
- Permission-aware
- The assistant is gated on the same permission as the reports section, so it can only surface figures that user could already see there — and a cited source only links to a screen the user may open.
- History, per user
- Conversations are stored under the account that asked, replayed exactly as answered at the time. One user’s exploratory questions are not a colleague’s business.
- Honest arithmetic
- Money is stored in minor units and quantities in grams underneath every report and every answer, so totals reconcile exactly — the same discipline the invoices themselves are built on.
The complete capability list
No analytics tier, no per-seat BI add-on. This is what reports, dashboards and the assistant do — for every plan.
Ask (AI assistant)
Plain-English questions against your live data.
Dashboards
The live command centre the day starts from.
Reports
Nine of them, over the same live documents.
Trust & control
Why the numbers can be believed — and shared safely.
Analytics over the documents, not beside them
There is no export step and no sync job. The dashboard, the reports and the assistant read the same purchase orders, sales orders, invoices and stock movements your team keys in — which is why they always agree.
Purchase orders
Approvals, receipts and landed costs — the spend side of every report here.
Inventory
Batch & lot stock with moving-average costing — what the stock figures stand on.
Sales & GST invoicing
The invoices behind receivables, P&L and the GSTR-1 HSN summary.
The whole platform
Partners, subsidiaries, users & permissions — every module the numbers come from.
Built for trading businesses, not data teams
If your questions sound like “what do they owe us?”, “what is the stock worth?” and “which supplier fed that lot?”, this is analytics in your vocabulary.
Wholesalers & distributors
Thin margins across many lines — margin trend and top-customer concentration, live.
Importers & exporters
Per-currency positions kept honest — figures in different currencies are never blended.
Dry fruits, nuts & spices
Stock worth by product group, expiring lots and reorder gaps — one question away.
Owner-operators
The dashboard replaces the Monday-morning spreadsheet ritual with one screen.
GST-registered businesses
The GSTR-1 HSN summary and CSV exports your accountant actually asks for.
Growing teams
Permission groups let staff see their numbers without opening the whole ledger.
Fewer exports, faster answers
“I stopped exporting to Excel to answer the owner’s questions. Now I type the question and forward the answer — with the query attached.”
“The dashboard caught an invoice drifting 40 days overdue that our old sheet had simply lost. That one catch paid for the year.”
“When a price changed and nobody owned up, the audit trail settled it in one search — who, when, and what it was before.”
Useful on day one, sharper every month
There is nothing to configure to get analytics — the reports and the assistant read the documents your team is already keying in.
Run your trade through the system
Purchase orders, sales orders, invoices and stock — from the first document, the dashboard and reports fill themselves.
Hand out the right permissions
Reports, financial figures, the audit trail and the assistant are gated separately, so each role sees its own numbers.
Start asking
Open the assistant beside your work and try the example questions — then the ones you have been saving for the accountant.
Questions traders actually ask
What kind of questions can the AI assistant answer?
Anything your trading data can answer: “Top 5 customers by invoiced sales this year”, “Which products are below their reorder level?”, “Overdue customer invoices, oldest first”, “Freight and other order costs booked this year, by cost type”. You type the question in plain English; the assistant turns it into a single database query over your purchases, sales, invoices, stock, costs and partners, and returns the figures as a table or chart with a short explanation.
Can the assistant change or delete my data?
No — it is read-only by construction, not by promise. Every generated query passes a guard that accepts exactly one SELECT statement: no updates, no deletes, no schema changes, no semicolons or comment tricks, and a hard cap of 500 rows. Anything else is rejected before it reaches the database.
How do I know an answer is right?
Every answer shows its work: the tables it read (derived from the query that actually ran, never from the model’s own claims), the exact SQL statement, the row count and the query time. The source chips link to the admin screens that list those records, so you can walk from any figure to the documents behind it.
Does the assistant see other customers’ data?
It cannot. Every customer’s data lives in its own database, and the assistant’s queries run on your connection only. Conversation history is personal too — your questions are stored under your account, and another user’s thread is simply not visible to you.
What reports are included?
Nine: sales orders, purchase orders, stock & inventory, invoices, order costs, profit & loss, position (receivables, payables and stock on hand, with aging), a GSTR-1 HSN summary for GST-registered businesses, and a per-partner trading summary. Each one has a filterable data grid and an analytics view over the same live figures.
Can I export report data to a spreadsheet?
Yes. Every report’s data tab exports the rows you are looking at — filters applied — to CSV, so your accountant or your own models work from exactly the figures on screen.
What does the audit trail record?
Every change that actually saved: who made it, when, and which fields moved from what to what. It is written at the persistence layer, so edits from any screen, imports and background jobs are all captured — and a change that failed to commit never leaves a phantom entry.
Can I control who sees financial figures?
Yes. Access is governed by composable permission groups: reports have their own permission, the financial panels (profit & loss, aging, balances) carry a separate financial permission, the audit trail has its own, and the assistant shares the reports permission — it can only surface what the reports section already exposes to that user.
Where to go next
Inventory management
Batch & lot traceability, moving-average costing and the movement ledger the stock reports stand on.
Read about inventory →GST billing & invoicing
The invoices behind receivables, the P&L and the GSTR-1 HSN summary.
Read about invoicing →Pricing
Straightforward plans — reports, dashboards and the assistant included, not gated behind a tier.
View pricing →Ask it a question about a business like yours
Thirty minutes, live. We will open the dashboard, walk two reports, and put your own questions to the assistant — and you will see the sources and the SQL behind every answer. We usually reply within one business day.
Already a customer? Log in to your back office.